Graphics by Jeff Allen and Byeonghwa Jeong
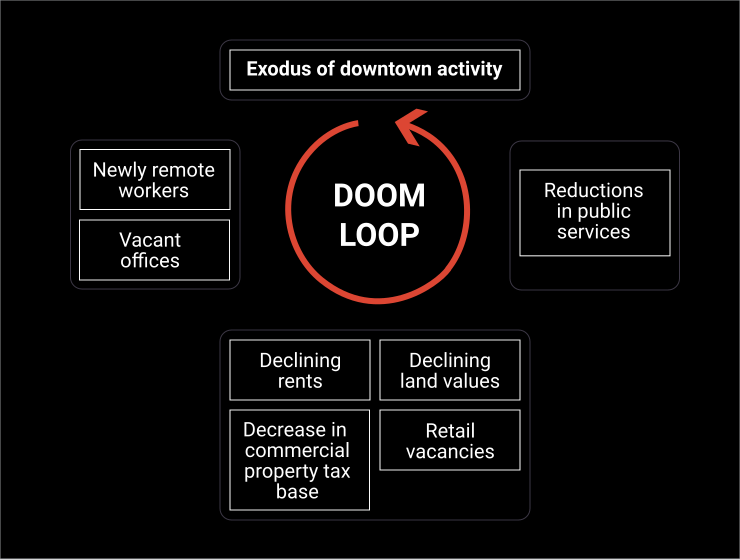
The slow return of office workers to downtowns in the United States and Canada has raised fears of the urban doom loop, a downward spiral in which empty offices and related decline in retail, restaurant, and entertainment expenditures downtown lead to declining rents and land values, decreases in the commercial property tax base, reductions in public services and safety, and an even greater exodus from downtown. The idea of the doom loop stems from 1970s fiscal crises of U.S. cities, such as New York, when the departure of corporate headquarters and middle-class city dwellers strained tax revenues, causing a decline in public services that impacted quality of life and reduced land values, resulting in more flight.
Researchers have struggled to determine whether cities should expect a post-pandemic doom loop, mostly because of the lack of appropriate data; although office vacancy rates hint at trends, data on office occupancy (and the frequency of remote work) is lacking. Moreover, the fiscal impact of the doom loop depends on how reliant cities are on revenue from property (and in the U.S., also sales) taxes. [1] One prominent example of this uncertainty is New York City, where economists have predicted a doom loop driven by work from home, but the Comptroller’s Office finds a recent “boom loop” of commercial tax revenues that surpass expectations. [2] Other studies have identified a slightly smaller impact on city coffers, generally ranging from 1 to 3 percent. [3]
Our recent working paper, published by the Lincoln Institute of Land Policy, overcame many of these research challenges by providing a more accurate assessment of current downtown office building utilization via cell phone data. This then allowed us to develop more realistic scenarios for the future of downtowns. And along the way, we discovered how Canadian cities have protected themselves from ever experiencing a doom loop.
Downtown recovery varies
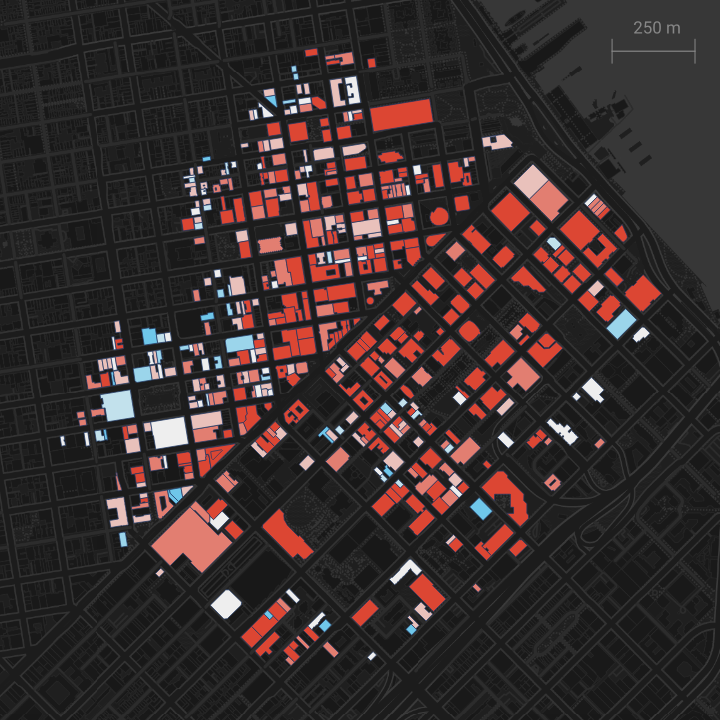
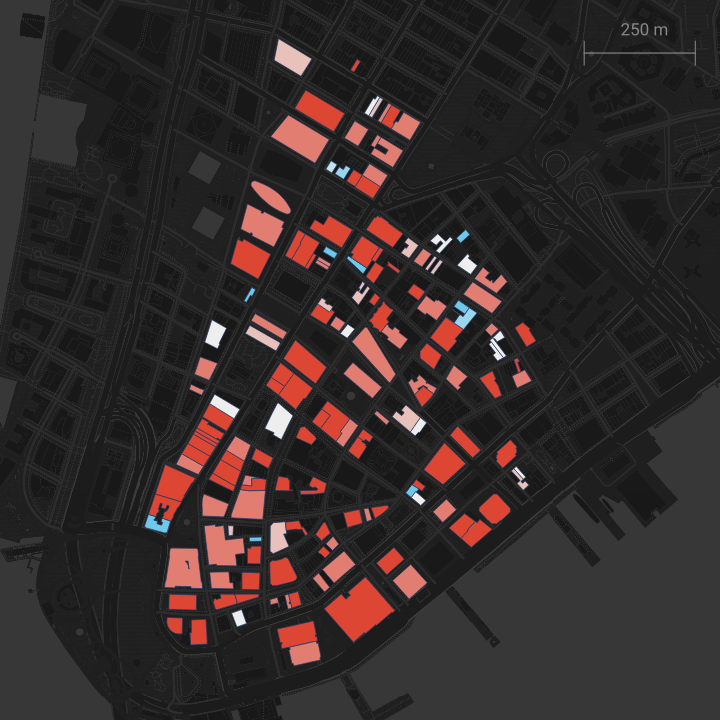
Downtown recovery has varied building by building. Figure 2 illustrates the diverse recovery trajectory (at least in mid-2023) of buildings in four downtowns: New York (both Midtown and the Financial District), San Francisco, Toronto, and Vancouver. The U.S. downtowns house a higher proportion of buildings with lower recovery rates (in red), while in Toronto and Vancouver, more buildings experienced moderate to high recovery rates (in blue). Recovery rates were unevenly distributed within each downtown area, regardless of whether the city was in the U.S. or Canada.
Downtown San Francisco
Recovery Rate % (2023 versus 2019)50%70%90%110%130%150%
New York Midtown
Recovery Rate % (2023 versus 2019)50%70%90%110%130%150%
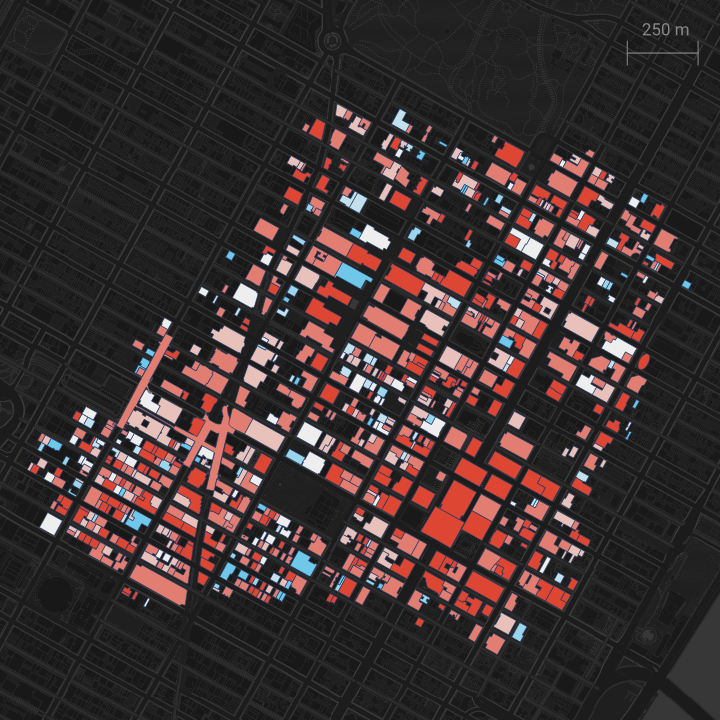
New York Financial District
Recovery Rate % (2023 versus 2019)50%70%90%110%130%150%
Downtown Toronto
Recovery Rate % (2023 versus 2019)50%70%90%110%130%150%
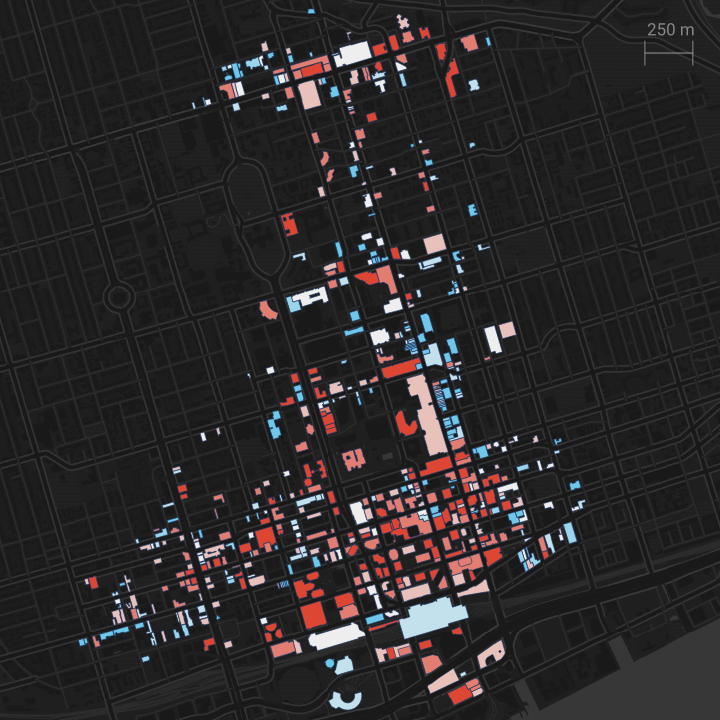
Downtown Vancouver
Recovery Rate % (2023 versus 2019)50%70%90%110%130%150%
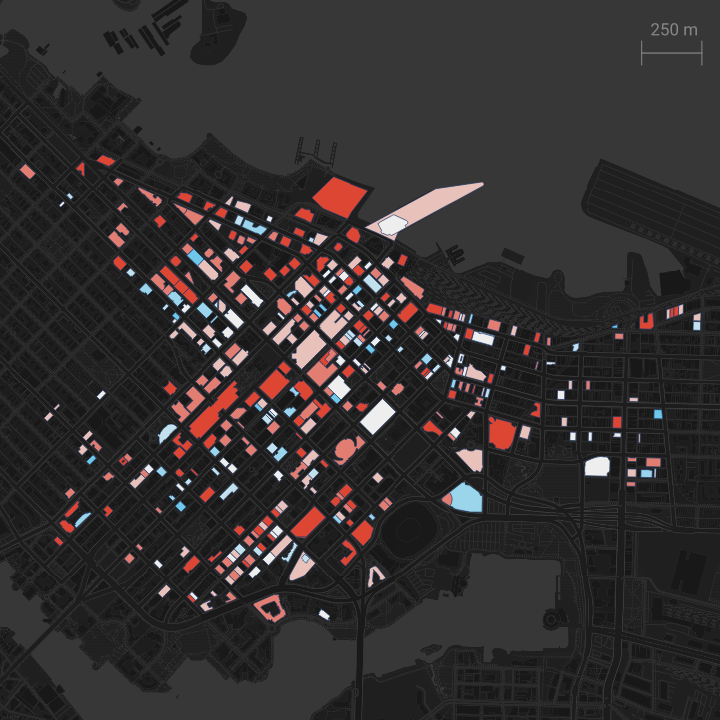
Our work at the Downtown Recovery Project suggests why recovery rates diverge. [4] Economic factors essentially determine downtown activity. The buildings downtown that host a concentration of sectors with remote/hybrid work options – such as information, finance, professional services, and management – display sluggish recovery. Overall, work from home has reduced demand for office space by about 23 percent on average. [5] Conversely, buildings with hotels, restaurants, entertainment, health care, and education exhibit greater resilience post-pandemic.
Analyzing scenarios for the future of downtown
Looking at trends in office space demand using both real estate and cell phone data, we modeled five scenarios of downtown and assessed value in the future: baseline (business as usual), recovery (return to pre-pandemic activity), modest recovery (more gradual return to pre-pandemic levels), remote (acceleration of remote work trends), and modest remote (more gradual shifts toward remote work). Even under a worst-case scenario of increased remote work and decreased downtown activity, the impact of decreased downtown commercial property tax revenues on city coffers will be minor, and highly unlikely to trigger a doom loop.
The full recovery scenario would mean an increase in revenue across cities. Under both baseline and remote scenarios, overall revenue would decrease by one percent or less in New York and Toronto, and from two to four percent in San Francisco. Vancouver would experience greater losses, with a decline of 13 percent to downtown revenues under the remote scenario. However, Vancouver is a special case; though much more dependent on commercial property tax, its tax base is dispersed across multiple subcentres, many of which are recovering faster than downtown. Plus, it benefits from how Canadian municipalities structure their tax revenue streams, as discussed next.
U.S. cities are resilient…but Canada’s are even more so
A four percent decrease in the budget will undoubtedly lead to serious cuts in services in some U.S. cities, but it is unlikely to result in the substantive changes to quality of life that accelerate a doom loop. Moreover, in Canadian cities, tax rates are continually adjusted to ensure revenue neutrality. In other words, the decrease in commercial real estate revenues will be met with an increase in rates on the residential side, essentially erasing the loss. The system thus builds in mitigation for any decline in revenues. [6]
This study suffers from a few limitations. Beyond impacts on the commercial property tax base, there could be related impacts on the income tax, the sales tax, user charges, and even intergovernmental aid that impact city budgets as well. We only examined four cities selected primarily for their reliance on sectors that have embraced remote work; however, there are other cities far more vulnerable because of their reliance on the commercial property tax. Future research using this kind of building-level microdata should include these cities as well.
The findings of this research should reassure local governments concerned about the likelihood of a doom loop, but this does not mean that problems for downtowns are over. Most downtowns still lack the activity levels they attracted five years ago. Diversifying land use to include more residential buildings, and the economy to include more sectors with essential workers, will make downtowns more resilient to future shocks. Even if the impact of the pandemic on commercial property tax revenue is unlikely to spur a doom loop, it does raise questions about the vulnerability of systems, like in the U.S., that do not adjust rates (as Canada does) to smooth out the impact of real estate downturns. U.S. jurisdictions could benefit from a hard look at the fiscal practices of their neighbour to the north.
References
In both Canada and the United States, property taxes are the largest contributor to municipal revenues (47 percent average in Canadian municipalities, and 31 percent average across U.S. local governments).⮝
A. Gupta, V. Mittal, and S.V. Nieuwerburgh, Work From Home and the Office Real Estate Apocalypse, SSRN, 2022; J. Bram, NYC’s Office Market: Doom Loop or Boom Loop? 2025.
Gupta’s et al. 2024 revision found less of a doom loop impact than they originally estimated in their 2022 paper, but still suggested that commercial tax revenue would drop by 47%. Instead, it has increased.⮝
T. Brosy, R. Auxier, N. Airi, G. Garriga, and M. Jha, The Future of Commercial Real Estate and City Budgets, The Urban-Brookings Tax Policy Center, May 1, 2024; H. Chernick, H., and A. Reschovsky, The Impact of the COVID-19 Pandemic on the Fiscal Health of American Central Cities, 2025, Lincoln Institute of Land Policy Working Paper.⮝
M. Leong, D. Huang, H. Moore, K. Chapple, L. Schmahmann, J. Wang, & N. Allavarpu, Can we save the downtown? Examining pandemic recovery trajectories across 62 North American cities, Cities, 143, 2023, ; A. Forouhar, K. Chapple, J. Allen, B. Jeong, & J. Greenberg, Assessing downtown recovery rates and determinants in North American cities after the COVID-19 pandemic, Urban Studies, 62(6), 1209-1231, 2025; A. Forouhar, K. Chapple, R. Pokharel, R., & J. Allen, Transit-driven resilience: Unraveling post-COVID-19 urban recovery dynamics, Journal of Transport Geography, 128, 2025.⮝
Chernick & Reschovsky, op. cit.⮝
However, there may be an impact on individual property owners, who will experience increased tax burdens as the rate increases.⮝